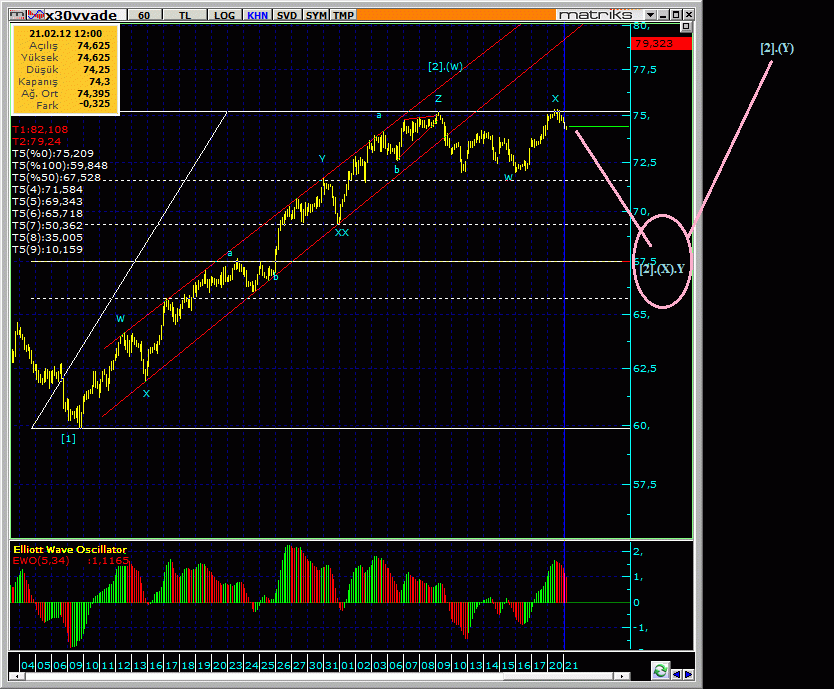
Ben dalgayı yukardaki gibi saydığım için,
piyasa bakıyo ,
saraylı öle saymış ,aşşağ dönüyo...şaka,şaka, haa....
bu megalomani komik bişi yaw...
matador şöyle:
61.900 den yukarı başlayan 3.dalga uzatma yaptı ve 4.a ile aşağı gelen düzeltme yatersiz kaldı bu dalganın hazmı için..
Halbuki 3.dalga için en azından bir %38 düzeltme bekleriz..piyasa bunu yapmalı..
ama dediğin gibi yukarı giderse bu da zaten alternatifimiz...sorunun cevabı bu...piyasa dinamiği ya da dalganın karakteri yani...

Burada yazdıklarım kişisel görüşlerimdir.
AL - SAT Tavsiyesi değildir.
Yatırım Danışmanlığı kapsamında değildir.
Ben de zaten ,pek bişi bilmem..
Bilip bilmediğimi bile bilmiyorum..
O kadar yani,..
Üzülmeyeyim,di mi?


Ben sn sarayli'ya bu katiliyorum, yurtdişiinin yükselişine de bakarsak orada da sürekli bitiriyorlar EW sayimlarında yükselişi ama bakiyorum ve son yükselişe C diyorlar iyi de C dalgasında 4 nerede diye ariyor um ama bulamıyorum.
Bizde de ben de israrla %38 gelir diye bekledim ve KISA lara yapiştim ama %38,2 yi birakın 23,6 da 2 li dip ile tekrar yukari atti.
zaman olarak 23,6 zamanda fiyat olrak ta 23,6 da kaldi düşüş.
38,2 geri alişta dir durup dinlenmek lazım ve sonraki dalgayi iyi irdelemek lazım
75200 ü ilk gördüğümüzde iç yapısını saydığım iki alternatifi sazan abinin topiğinde paylaşmıştım.
itikisel sayım: http://666kb.com/i/c14zrlus2wuddw9fk.png
Düzeltme sayım : http://666kb.com/i/c14zwxbj8mibbnjcw.png
güncel hali ise böyle

eski nickim:trader38
Burada yazılanları beyninde özümleme yapmadan uygulayan kişilerin zarar etmesi kaçınılmazdır. ben daha kendini kurtaramamış acemi bir vobcuyum


equis sitesindeki bilgi:
Questions about MetaStock Renko and 3 Line Break Charts.
Questions about MetaStock Renko and 3 Line Break Charts.
We have had a number of users ask why their Renko and 3 Line Break "bricks" change on their charts as time passes. Although it may seem at first glance to be a problem, this is actually normal behavior. Perhaps the following example will illustrate why.
Suppose you are loading 1000 periods (about 4 years) of data for a security, and the very first period has a close of 95, the second has 100, the third period has a close of 97, the fourth has a close of 103, and the fifth has a close of 107. We will use the default box size, which is 5. With a starting point of 95 (the first period), a brick would be made from 95 to 100, from the first day to the second. The second brick would extend from 100 to 105, from the second day to the fifth day. This is how the chart would begin, and all the rest of the bricks would begin and end on 5s and 0s on the Y-axis scale.
The next day, after collecting another period of data, the same number of periods is loaded (1000) but now the period which was second (close of 100) is first, and the period which was first (close of 95) isn't loaded. The first box would extend from 100 to 105, from the first day to the fourth day. The scale would be the same for the rest of the chart, since the difference between the closes for the previous first date and the new first date is the same as the box size.
Moving forward another day, you will see every single box on the chart change. As the new first box starts with a close of 97, every box on the chart now shifts to begin and end with a 7 or a 2 on the Y-axis. Although the day before the first 4 days were represented by a single brick, now we have the first 3 days represented by 2 bricks-from 97 to 102, for the first day to the second, and from 102 to 107, for the second day to the third. This is exactly how Renko and 3 Line Break is supposed to work, and as long as your chart that you load begins with the same date, the bricks will not change. But when the first loaded date changes, the bricks may or may not change, depending on the data and the box size used.
Kimseye birşey tavsiye etmiyorum, sadece fikirlerimi yazıyorum.


bu durumda 65500 verinin tümünü yüklemek hatayı azaltacaktır sanırım
Kimseye birşey tavsiye etmiyorum, sadece fikirlerimi yazıyorum.
tşk ler anonim,Hilmi Bey haklı bu durumda,data yükleme tarihini aynı yerde başlatmak lazım geçmişteki hiçbir tuğlanın değişmemesi için..
öyle anladım...bu durumda Emabandvar lar sanırsam değişmez ama,bazen tuğlalar değişik olacağı için kesişimler değişir...fark olur yani...

Burada yazdıklarım kişisel görüşlerimdir.
AL - SAT Tavsiyesi değildir.
Yatırım Danışmanlığı kapsamında değildir.
Ben de zaten ,pek bişi bilmem..
Bilip bilmediğimi bile bilmiyorum..
O kadar yani,..
Üzülmeyeyim,di mi?


yine equis sayfasından
Calculation:
Renko charts are always based on closing prices. You specify a "box size" which determines the minimum price change to display.
To draw Renko bricks, today's close is compared with the high and low of the previous brick (white or black):
If prices move more than the box size, but not enough to create two bricks, only one brick is drawn. For example, in a two-unit Renko chart, if the prices move from 100 to 103, only one white brick is drawn from 100 to 102. The rest of the move, from 102 to 103, is not shown on the Renko chart.
- <LI class=TAAZText>If the closing price rises above the top of the previous brick by at least the box size, one or more white bricks are drawn in new columns. The height of the bricks is always equal to the box size.
- If the closing price falls below the bottom of the previous brick by at least the box size, one or more black bricks are drawn in new columns. Again, the height of the bricks is always equal to the box size.
Kimseye birşey tavsiye etmiyorum, sadece fikirlerimi yazıyorum.
hocam üyeliğim daha yeni aktive oldu.teşekkür etme fırsatı bulamamıştım.bize balık tutmayı öğrettiğiniz için çok teşekkür ederim.arkadaşlardaki bar sorunu bendede var.ama emabandların değişmediğini sanıyorum.bendeki son emaband değerleri sırasıyla şöyle.74425-74575-74600 diğer arkadaşlarda yazarsa eşleştiririz.
Şu an 1 kullanıcı var. (0 üye ve 1 konuk)
Yer imleri